Integration Overview
Introduction
One of the reasons that Shinken is such a popular monitoring application is the fact that it can be easily integrated into your existing infrastructure. There are several methods of integrating Shinken with the management software you’re already using and you can monitor almost any type of new or custom hardware, service, or application that you might have.
Integration Points
Important
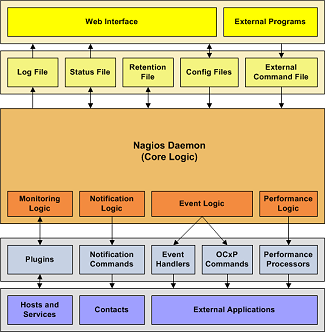
This diagram is deprecated and illustrates legacy Nagios. Which has nothing to do with the new architecture. eck.
To monitor new hardware, services, or applications, check out the docs on:
It is also possible to use Shinken Poller daemon modules or Receiver daemon modules to provide daemonized high performance acquisition. Consult the Shinken architecture to learn more about poller modules. There are existing poller modules that can be usd as examples to further extend Shinken.
To get data into Nagios from external applications, check out the docs on:
To send status, performance, or notification information from Shinken to external applications, there are two typical paths. Through the Reactionner daemon which executes event handlers and modules or through the Broker daemon. The broker daemon provides access to all internal Shinken objects and state information. Thi data can be accessed through the Livestatus API. The data can also be forwarded by broker modules. Check out the docs on:
- Broker modules
- Event Handlers
- OCSP and OCHP Commands
- Performance Data
- Notifications
Integration Examples
I’ve documented some examples on how to integrate Shinken with external applications:
- TCP Wrappers Integration (security alerts)
- SNMP Trap Integration (Arcserve backup job status)