Monitoring Plugins
Introduction
Shinken includes a set of scalable internal mechanisms for checking the status of hosts and services on your network. These are called modules and can be loaded by the various Shinken daemons involved in data acquisition (Poller daemons, Receiver daemons, Arbiter Daemon) Shinken also relies on external programs (called check plugins) to monitor a very wide variety of devices, applications and networked services.
What Are Plugins?
Plugins are compiled executables or scripts (Perl scripts, shell scripts, etc.) that can be run from a command line to check the status of a host or service. Shinken uses the results from plugins to determine the current status of hosts and services on your network and obtain performance data about the monitored service.
Shinken will execute a plugin whenever there is a need to check the status of a service or host. The plugin does something (notice the very general term) to perform the check and then simply returns the results to Shinken. It will process the results that it receives from the plugin and take any necessary actions (running event handlers, sending out notifications, etc).
Shinken integrated data acquisition modules
These replace traditional unscalable plugins with high performance variants that are more tightly coupled with Shinken.
- Integrated Shinken data acquisition modules support the following protocols:
- NRPE
- SNMP
Plugins As An Abstraction Layer
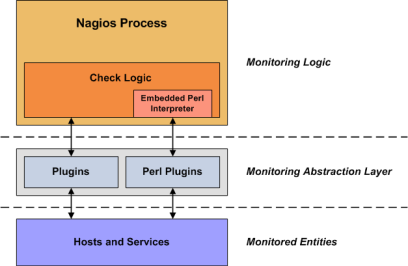
DEPRECATED IMAGE - TODO Replace with the Shinken specific architecture diagram.
Plugins act as an abstraction layer between the monitoring logic present in the Shinken daemon and the actual services and hosts that are being monitored.
The upside of this type of plugin architecture is that you can monitor just about anything you can think of. If you can automate the process of checking something, you can monitor it with Shinken. There are already literally thousands of plugins that have been created in order to monitor basic resources such as processor load, disk usage, ping rates, etc. If you want to monitor something else, take a look at the documentation on writing plugins and roll your own. It’s simple!
The downside to this type of plugin architecture is the fact that Shinken has absolutely no idea about what is monitored. You could be monitoring network traffic statistics, data error rates, room temperate, CPU voltage, fan speed, processor load, disk space, or the ability of your super-fantastic toaster to properly brown your bread in the morning... Shinken doesn’t understand the specifics of what’s being monitored - it just tracks changes in the state of those resources. Only the plugins know exactly what they’re monitoring and how to perform the actual checks.
What Plugins Are Available?
There are plugins to monitor many different kinds of devices and services.
They use basic monitoring protocols including:
- WMI, SNMP, SSH, NRPE, TCP, UDP, ICMP, OPC, LDAP and more
They can monitor pretty much anything:
- Unix/Linux, Windows, and Netware Servers
- Routers, Switches, VPNs
- Networked services: “HTTP”, “POP3”, “IMAP”, “FTP”, “SSH”, “DHCP”
- CPU Load, Disk Usage, Memory Usage, Current Users
- Applications, databases, logs and more.
Obtaining Plugins
Shinken also organizes monitoring configuration packages. These are pre-built for fast no nonsense deployments. They include the check command definitions, service templates, host templates, discovery rules and integration hooks to the Community web site. The integration with the community web site permits deployment and updates of monitoring packs.
Get started with Shinken Monitoring Packages “Packs” today.
The plugins themselves are not distributed with Shinken, but you can download the official Monitoring-plugins and many additional plugins created and maintained by Nagios users from the following locations:
- Monitoring Plugins Project: https://www.monitoring-plugins.org/
- Nagios Downloads Page: http://www.nagios.org/download/
- NagiosExchange.org: http://www.nagiosexchange.org/
How Do I Use Plugin X?
Most plugins will display basic usage information when you execute them using “-h” or “–help” on the command line. For example, if you want to know how the check_http plugin works or what options it accepts, you should try executing the following command:
./check_http --help