Shinken Architecture
Summary
Shinken’s architecture has been designed according to the Unix Way: one tool, one task. Shinken has an architecture where each part is isolated and connects to the others via standard interfaces. Shinken is based on a HTTP backend. This makes building a highly available or distributed monitoring architectures quite easy.
- Shinken gets data IN
- passively
- actively
- Networked API
- Shinken acts on the data
- Correlation
- Event suppression
- Event handlers
- Adding new poller daemons
- Runtime interaction
- Shinken gets data OUT
- Networked API
- Notifications
- Logging
- Web/Mobile Frontend (via API and Native WebUI)
- Metrics databases
- Shinken manages configurations
- Discovery manager SkonfUI
- Multi-level discovery engine
- Configuration Packs (commands, config templates, graph templates, etc.)
- Text file management via configuration engines (cfengine, chef, puppet, salt)
Shinken innovative features
Learn more about the innovative features of Shinken.
Shinken data acquisition for monitoring
Shinken needs plugins to actually gather data. There exists **thousands** of plugins for every conceivable application. Shinken packages the configurations necessary to use common plugins in Packs. Plugins themselves need to be installed by the administrator of the monitoring solution(Shinken will install some common ones for you). This is a great strength and flexibility of Shinken, but also an administrative responsibility to download and install the necessary plugins.
Architecture diagram with all daemons illustrated
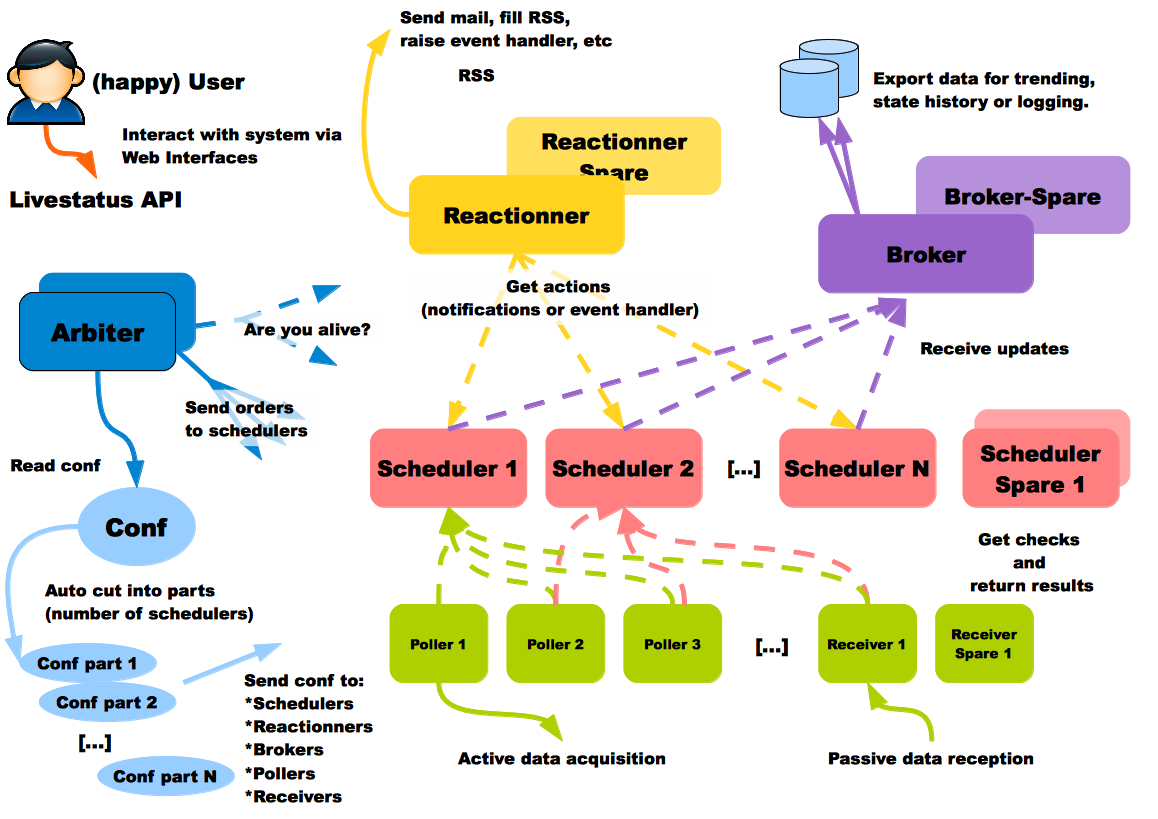
Shinken Daemon roles
- Arbiter: The arbiter daemon reads the configuration, divides it into parts (N schedulers = N parts), and distributes them to the appropriate Shinken daemons. Additionally, it manages the high availability features: if a particular daemon dies, it re-routes the configuration managed by this failed daemon to the configured spare. Finally, it can receive input from users (such as external commands from nagios.cmd) or passive check results and routes them to the appropriate daemon. Passive check results are forwarded to the Scheduler responsible for the check. There can only be one active arbiter with other arbiters acting as hot standby spares in the architecture.
- Modules for data collection: NSCA, TSCA, Ws_arbiter (web service)
- Modules for configuration data storage: MongoDB
- Modules for status retention: PickleRententionArbiter
- Modules for configuration import: MySQLImport, GLPI, Landscape(Ubuntu)
- Modules for configuration modification: vmware autolinking, IP_Tag, and other task specific modules
- Scheduler: The scheduler daemon manages the dispatching of checks and actions to the poller and reactionner daemons respectively. The scheduler daemon is also responsible for processing the check result queue, analyzing the results, doing correlation and following up actions accordingly (if a service is down, ask for a host check). It does not launch checks or notifications. It just keeps a queue of pending checks and notifications for other daemons of the architecture (like pollers or reactionners). This permits distributing load equally across many pollers. There can be many schedulers for load-balancing or hot standby roles. Status persistence is achieved using a retention module.
- Modules for status retention: pickle, nagios, memcache, redis and MongoDB are available.
- Poller: The poller daemon launches check plugins as requested by schedulers. When the check is finished it returns the result to the schedulers. Pollers can be tagged for specialized checks (ex. Windows versus Unix, customer A versus customer B, DMZ) There can be many pollers for load-balancing or hot standby spare roles.
- Module for data acquisition: NRPE Module
- Module for data acquisition: CommandFile (Used for check_mk integration which depends on the nagios.cmd named pipe )
- Module for data acquisition: SnmpBooster (NEW)
- Reactionner: The reactionner daemon issues notifications and launches event_handlers. This centralizes communication channels with external systems in order to simplify SMTP authorizations or RSS feed sources (only one for all hosts/services). There can be many reactionners for load-balancing and spare roles
- Module for external communications: AndroidSMS
- Broker: The broker daemon exports and manages data from schedulers. The broker uses modules exclusively to get the job done. The main method of interacting with Shinken is through the Livestatus API. Learn how to configure the Broker modules.
- Modules for the Livestatus API - live state, status retention and history: SQLite (default), MongoDB (experimental)
- Module for centralizing Shinken logs: Simple-log (flat file)
- Modules for data retention: Pickle , ToNdodb_Mysql, ToNdodb_Oracle, <del>couchdb</del>
- Modules for exporting data: Graphite-Perfdata, NPCDMOD(PNP4Nagios), raw_tcp(Splunk), Syslog
- Modules for the Shinken WebUI: GRAPHITE_UI, PNP_UI. Trending and data visualization.
- Modules for compatibility/migration: Service-Perfdata, Host-Perfdata and Status-Dat
- Receiver (optional): The receiver daemon receives passive check data and serves as a distributed command buffer. There can be many receivers for load-balancing and hot standby spare roles. The receiver can also use modules to accept data from different protocols. Anyone serious about using passive check results should use a receiver to ensure that check data does not go through the Arbiter (which may be busy doing administrative tasks) and is forwarded directly to the appropriate Scheduler daemon(s).
- Module for passive data collection: NSCA, TSCA, Ws_arbiter (web service)
Tip
The various daemons can be run on a single server for small deployments or split on different hardware for larger deployments as performance or availability requirements dictate. For larger deployments, running multiple Schedulers is recommended, even if they are on the same server. Consult planning a large scale Shinken deployment for more information.
Learn more about the Shinken Distributed Architecture
The Shinken distributed architecture, more features explained.
If you are just starting out, you can continue on with the next tutorial, which will help you Configure a web front-end.
Planning a large scale Shinken deployment
If you wish to plan a large scale installation of Shinken, you can consult the Scaling Shinken reference.
This is essential to avoid making time consuming mistakes and aggravation.